Glaucoma

Glaucoma is won or lost in the trend.

An isolated IOP tells you nothing; the curve does. iGalenus charts it for you.

Create my account

14-day trial. No card needed to sign up.
View clinical demos
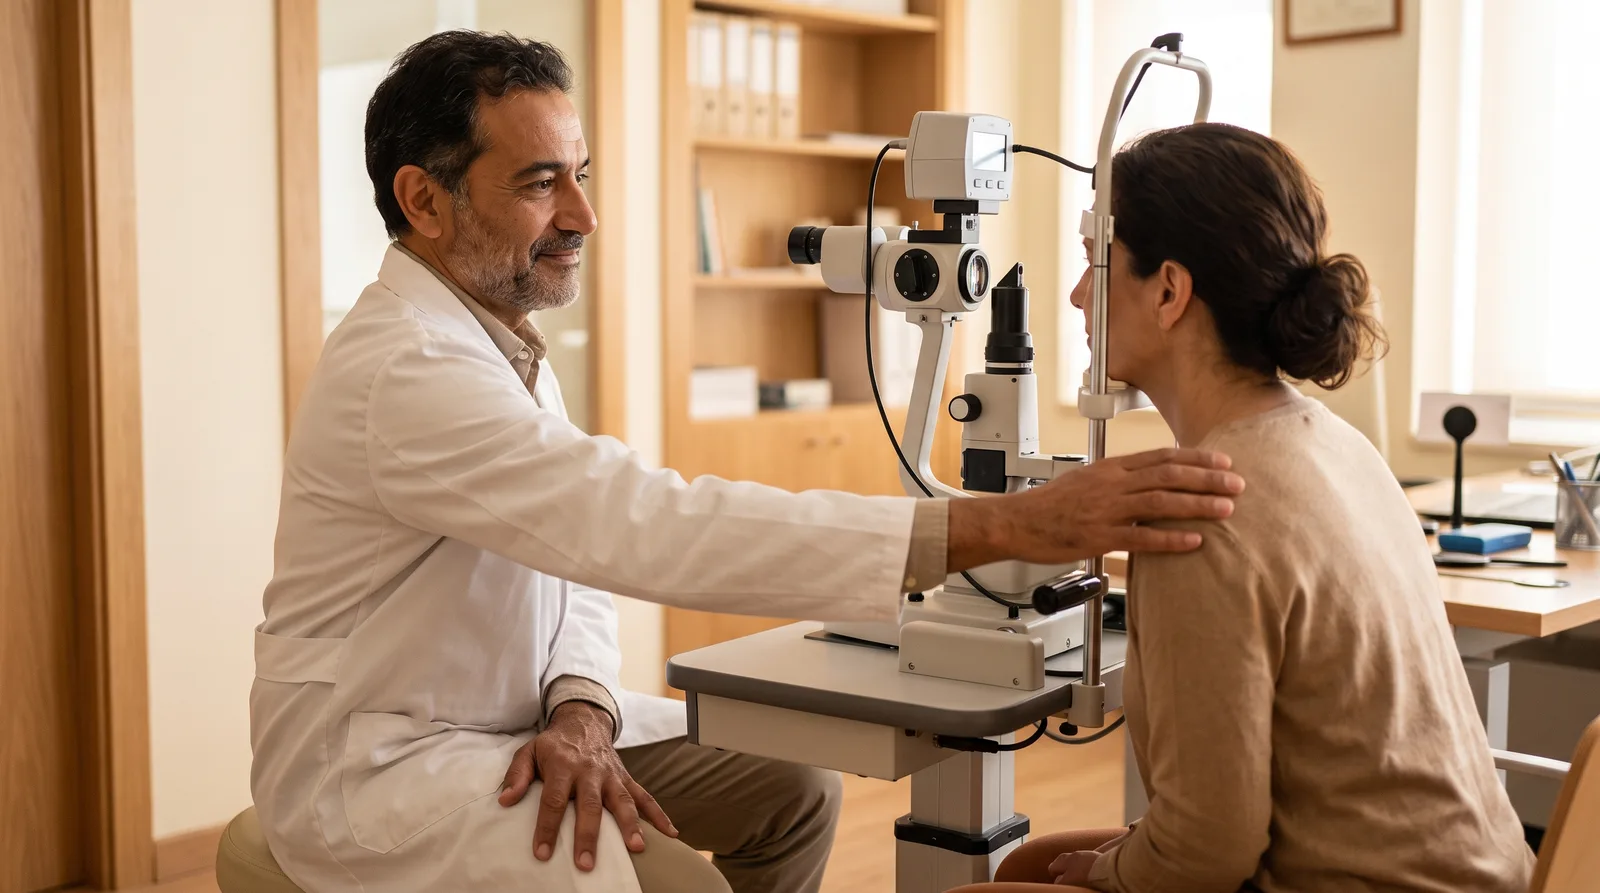
A gray-haired physician rests a hand on a patient's shoulder during the exam. Illustrative image generated with AI.

A glaucoma consultation

Intraocular pressure

Method recorded
OD24 mmHg
OS19 mmHg
MethodApplanation
Pachymetry540 µm

The IOP is saved with its method and its pachymetry.

Gonioscopy

By quadrant, with Shaffer
SuperiorShaffer 3
InferiorShaffer 3
NasalShaffer 2
TemporalShaffer 2

The angle is graded by quadrant.

Nerve and visual field

Charted
C/D0.7
Visual fieldArcuate defect
MD−6.2 dB

Every study adds to the trend.

Plan

Target IOP in the plan
Target IOP in the plan18 mmHg or less
StageModerate glaucoma

The trend tells you whether the target is being reached.

Review and sign

You sign
Glaucoma noteDemo Patient · ready for review

Sign note

Note signed

AI proposes. You review and sign.

Illustrative example, fictitious data.

How it's captured

The angle is graded by quadrant. The note writes itself.

Quadrant gonioscopy with Shaffer grading, right eye Anterior chamber angle of the right eye divided into four quadrants. Superior and temporal at Shaffer grade II (trabecular meshwork visible); nasal and inferior at grade III (scleral spur visible). The higher the grade, the wider the angle. Superior: Shaffer II — Trabecular meshworkNasal: Shaffer III — Scleral spurInferior: Shaffer III — Scleral spurTemporal: Shaffer II — Trabecular meshwork IISuperiorIIINasalIIIInferiorIITemporal
  • Shaffer 0 · No structures visible
  • Shaffer I · Schwalbe's line
  • Shaffer II · Trabecular meshwork
  • Shaffer III · Scleral spur
  • Shaffer IV · Ciliary body band
What the system writes into the note on its own OD: open angle, Shaffer II superior and temporal, Shaffer III nasal and inferior. No peripheral anterior synechiae. Trabecular pigment grade 2.

Your progress, charted

Trend in IOP and mean deviation (MD) across visits Illustrative sample chart: intraocular pressure falls from 24 to 15 mmHg and reaches the plan's target IOP, while the mean deviation of the visual field stays nearly stable. 25201510mmHg−4−4.5−5−5.5dBTarget IOPV1V2V3V4V5Successive visits IOPMean deviation
  • IOP · 24 → 15 mmHg
  • Mean deviation (MD) · −4.2 → −5 dB
Illustrative example

This is the trend the system charts on its own, from what you already capture at each visit. The values are an illustrative example, not a real patient.

Illustrative sample chart with made-up data. Does not correspond to any patient.

From dictation to signature

AI proposes. You review and sign.

From dictation to signed note Four steps in order: dictation, structured note, note review before signing, and the doctor's signature. Artificial intelligence proposes; the doctor confirms and signs. DictationYou speakwhile you examineStructured noteThe AI proposeseach fieldNOM-004 reviewBefore signing,score from 0 to 100Doctor's signatureYou confirmand sign From dictation to signed note Four steps in order: dictation, structured note, note review before signing, and the doctor's signature. Artificial intelligence proposes; the doctor confirms and signs. DictationYou speakwhile you examineStructured noteThe AI proposeseach fieldNOM-004 reviewBefore signing,score from 0 to 100Doctor's signatureYou confirmand sign
AI proposes; you confirm and sign. Once signed, the note is immutable.

Try the Glaucoma note with your own data.

What costs you time today

The IOP from two years ago is on a sheet, in another office or nowhere at all.

Gonioscopy is described in prose and nobody can compare it later.

The visual field and optic nerve OCT arrive as PDFs and stay in the PDF.

At iGalenus

What the Glaucoma record includes.

IOP with method and pachymetry

Goldmann, iCare, Tonopen, or pneumatic: the method is stored next to the value.

Gonioscopy by quadrant, with Shaffer

Visible structure per quadrant, translated to a Shaffer grade from 0 to 4.

Angle findings

Synechiae, angle recession, neovessels, iridotomy and prior surgery.

Optic nerve, charted

C/D and RNFL by OCT go straight into the trend chart.

Visual field with MD and PSD

Defect pattern and indices; MD is charted over time.

Classification and staging

From suspect to neovascular glaucoma, with mild, moderate, or advanced staging.

Target IOP in the plan

Target IOP in mmHg, laser (SLT or YAG iridotomy) and surgery.

Visual field comparison supported

It won't let you compare a 24-2 against a 30-2 without warning you.

And everything else is still there.

Scheduling and rescheduling by WhatsApp AI dictation Prescriptions with QR Payments, invoicing, and inventory NOM-004 before signing Optical Patient portal

Questions about Glaucoma

What we're usually asked.

Can I see a patient's IOP trend on a chart?

Yes. Each eye's IOP, corrected visual acuity, C/D ratio, RNFL and the visual field MD are charted automatically from what you enter in each note. There's nothing to export or re-enter.

Is gonioscopy saved as a drawing or as text?

Both. You enter it on a quadrant map or by selecting the visible structure; the system calculates the Shaffer grade and writes the finding as text in the signed note.

Does it work for a glaucoma clinic with several physicians?

Yes. The patient's trend belongs to the record, not to the physician, so any ophthalmologist with permission sees the same curve. Every access is recorded in the log required by NOM-024.

Your Glaucoma record, ready to go.

Create my account

14-day trial. No card needed to sign up.

See pricing
Create my account